Politicians are constantly exhorting us to get out of our “polluting” cars and onto “clean” public transport – and criticising us – from the comfort of their chauffeured limousines, of course – for not doing so.
Well you can rest easy: in your car, you are in the least polluting form of motorised conveyance. Using publicly-accessible sources quoted in the references below, a very different picture from the political dogma emerges:

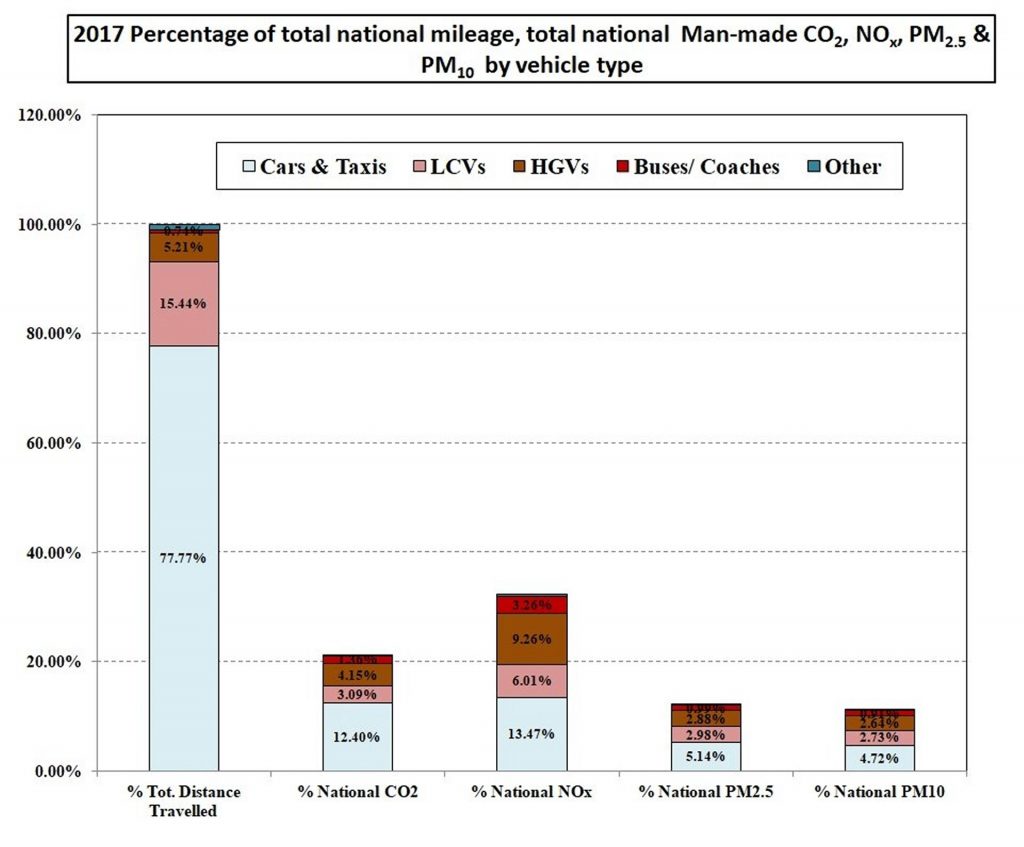
Cars and taxis account for 77.8% of all national road miles travelled, but are responsible for just 12.4% of national emissions of CO2, 13.5% of national NOx, 5.1% national PM2.5 and 4.7% of national PM10.
Further, on an emissions per billion kilometres basis, a typical bus would need to permanently (24/7 x 365) carry a respective minimum of 25 and 20 passengers to achieve parity on NOx and PMs with a typical, singly-occupied private car. If the car is carrying, say one-, two-, or three passengers, the numbers get worse for public transport by a factor of two, three and four; dramatically further worsening if the car is Euro 6 compliant.
| Vehicle Type | BnVkm (2017)3 | % of Total Distance travelled (2017) | % of National Man-made CO21,2 | % of National Man-made NOx1,2 | % of National Man-made PM2.51,2 | % of National Man-made PM101,2 |
| Cars & Taxis | 409.4 | 77.77 | 12.40 | 13.47 | 5.14 | 4.72 |
| LCVs | 81.3 | 15.44 | 3.09 | 6.01 | 2.98 | 2.73 |
| HGVs | 27.4 | 5.21 | 4.15 | 9.26 | 2.88 | 2.64 |
| Buses/Coaches | 3.9 | 0.74 | 1.36 | 3.26 | 0.99 | 0.91 |
| Other5 | 4.4 | 0.84 | 0.29 | 0.29 | 0.11 | 0.10 |
| Total | 526.4 | 100.00 | 21.27 | 32.29 | 12.11 | 11.10 |
So don’t let duplicitous politicians and eco-zealots pull the wool over your eyes. Persecution of car drivers on emissions grounds is entirely unjustified. Accept NONE of their car bans, ULEZs etc which are all empty virtue-signalling to disguise rapacious, entirely revenue-led policies which have no justification in fact – and even less in science.
References:
1Tate, Dr. James, University of Leeds: “Vehicle Emission Measurement and Analysis – Sheffield City Council”, December 2013 – survey of 28,200 vehicles
2https://assets.publishing.service.gov.uk/government/uploads/system/uploads/attachment_data/file/778483/Emissions_of_air_pollutants_1990_2017.pdf
3 Road Traffic Levels: Traffic (www.gov.uk/government/organisations/department-for-transport/series/road-traffic-statistics)
4 Global Road Transport % of Man-made CO2 emissions
5 Estimated at 2x typical car/ taxi emissions per BnVkm; most motorbikes having no emissions controls, plus heavy industrial plant vehicles are also in this category.

