Transport Democracy?
Do you expect to travel when and where you choose?
After all the UK is a democracy, right?
Wrong, Government insists 50 % of journeys should be by walking or cycling!
To persuade citizens they continuously make driving more expensive, more difficult and encourage anti-car programs by providing grants for Local Councils to encourage a choice that only a minority want.
These Government figures show what you as citizens choose for transport.
Average trips by purpose and main mode, as a proportion of all modes
| Mode | Walk | Pedal cycle | Cars and vans | Other private transport | Bus | Rail | Taxis and minicabs | Other public transport |
| Commuting | 11% | 4% | 68% | 1% | 6% | 9% | 1% | 0% |
| Business | 10% | 2% | 78% | 1% | 5% | 4% | 1% | 0% |
| Education and escort education | 43% | 1% | 46% | 3% | 5% | 1% | 1% | 0% |
| Shopping | 27% | 1% | 64% | 0% | 5% | 1% | 1% | 0% |
| Other escort | 12% | 0% | 86% | 0% | 1% | 0% | 1% | 0% |
| Personal business | 20% | 1% | 73% | 1% | 3% | 1% | 1% | 0% |
| Leisure | 11% | 4% | 77% | 1% | 3% | 3% | 1% | 0% |
| Other, including just walk | 100% | 0% | 0% | 0% | 0% | 0% | 0% | 0% |
| All purposes | 31% | 2% | 59% | 1% | 4% | 2% | 1% | 0% |
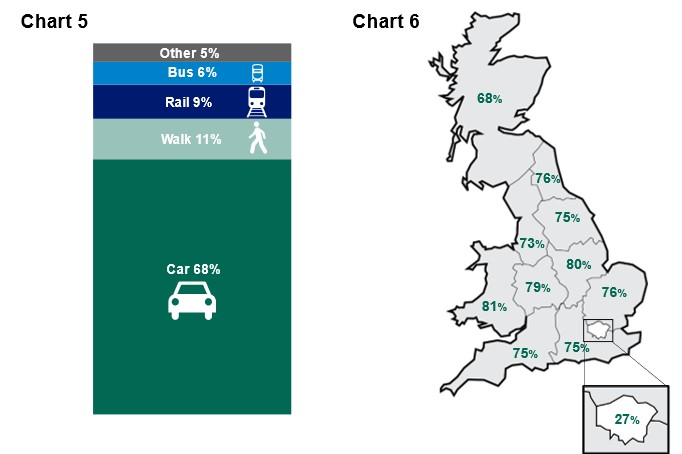
Perhaps there is a reason for this undemocratic distribution of transport funding this is the national regional distribution of transport mode usage.

Remember these are Government numbers yet they continue to fund and state we should park our cars and walk or cycle. It only works in London.
People will always choose the easiest way of travel and clearly it is Car or Van


